In this post, we share interesting customer service statistics in the form of an infographic.
Did you know that about half of consumers would rather have a root canal than contact customer support? That is the opposite of what might be expected in an environment where study after study documents the causal relationships between high-quality service and customer retention.
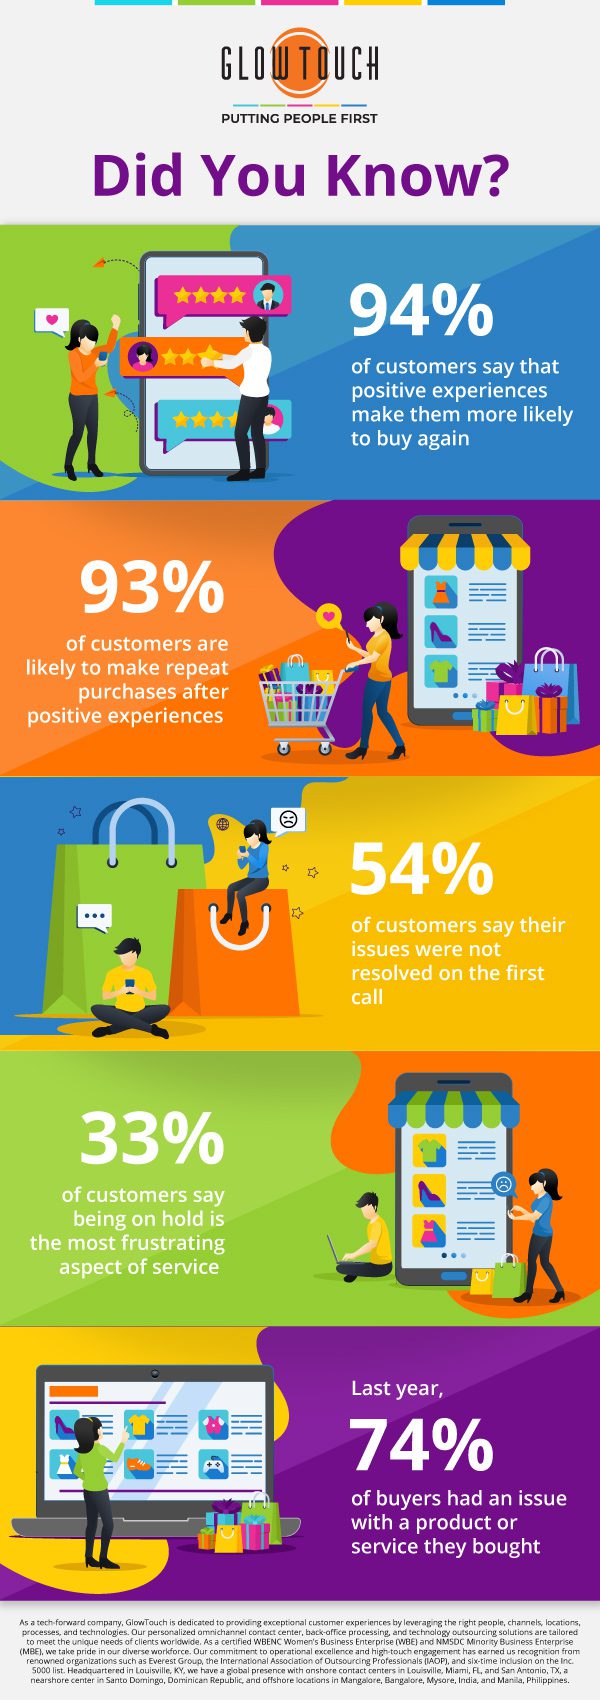
In the accompanying infographic, we highlight five customer service statistics that show the interaction between customer care and consumer behavior. Before that, though, did you know….
…that the term “customer experience,” was coined in 1994 and a Marketing Management magazine article on the subject? That has since been shorted to CX, which is not to be confused with UX.
The two decades from 1990-2010 marked a turning point in the dynamic between the producers of goods and services and the people who consume them. Innovative technologies and shifts in consumer sentiment have changed the power structure, tilting the scale in favor of customers.
Now about our infographic. Let’s start with something that should surprise no one:
94% of customers say that positive experiences make them more likely to buy again
That is backed up by data that shows service quality as a leading driver of buying decisions, to the point that the experience counts for more than price. Shoppers may still love bargains, but they prefer being pampered and treated as something more than transactions on a balance sheet.
This finding is echoed by another survey that found:
93% of customers are likely to make repeat purchases after positive experiences
It’s unclear why there is a 1% differential between the two, but the point should be clear – a seamless buying experience that includes good service sets the tone for creating loyalty between users and brands.
So, what are the points of friction in service delivery? If this is truly the “platinum age” of the customer experience, then there is no way this should happen:
54% of customers say their issues were not resolved on the first call
There may not be a more common metric within the service industry, especially for outsourcing providers, than first-call resolution. The rate at which issues are properly resolved on the first try affects everything from customer satisfaction to agent efficiency to workload. Customers understand that things happen, even with the best brands. But they also associate brand quality with how efficiently issues are resolved.
While people are willing to wait a bit longer if the result is first-call resolution, the subject of waiting is its own source of anxiety:
33% of customers say being on hold is the most frustrating aspect of service
This point and the one before can be addressed by investing in training so that agents are completely comfortable when they start interacting with live customers. Our proprietary WoW instruction lays this foundation by training all new employees on the value of the customer experience and their role in making it memorable.
This is also where the value of agent-assisting AI and machine learning tools is worth the investment. These technologies, such as our WizDom virtual assistant, not only help support personnel find answers more quickly and with greater accuracy, but they also preserve the live agent atmosphere that customers prefer.
No matter where consumers rank their fondness for customer support, odds are that they will need it at some point:
Last year, 74% of buyers had an issue with a product or service they bought
Again, issues happen. Service quality is defined by their resolution – how quickly was the matter settled, was it done right the first time, and was the agent engaging and empathetic? The last factor – the agent – is the most vital cog in the machine.
A person who treats the customer like a valued guest, actively listens, asks clarifying questions, and sounds upbeat can overcome a great deal of customer frustration. When service personnel can solve issues and change the customer’s perception of a brand, that is service. Perhaps even an uncommon level of service. From The Uncommon BPOTM.


 94% of customers say that positive experiences make them more likely to buy again
 93% of customers are likely to make repeat purchases after positive experiences
 54% of customers say their issues were not resolved on the first call
 33% of customers say being on hold is the most frustrating aspect of service
 Last year, 74% of buyers had an issue with a product or service they bought